
It’s 3am. PagerDuty is screaming. Checkout is failing for some customers but not others. You SSH into a box, tail the logs, and you’re greeted with a wall of INFO: processing request lines with no order ID, no user ID, no trace of which downstream service choked. Now you’re not debugging — you’re archaeology.
I’ve been on the other side of that night more times than I’d like to admit. And honestly, the difference between a 5-minute fix and a 3-hour outage is almost never the bug itself. It’s whether your logs told you anything useful. So let’s talk about what good logging actually looks like — not the textbook “log everything” advice, but the stuff that saves you when production is on fire.
Why most logging is useless when you need it most
Here’s the uncomfortable truth: most teams don’t log the wrong amount, they log the wrong things in the wrong way. Without a clear strategy, logs become noisy, unstructured, expensive, and nearly useless during an incident [1]. You end up paying a fortune to store gigabytes of user clicked button and then can’t find the one line that explains why a payment failed.
A log line exists for exactly one reason: so future-you, mid-incident, can reconstruct what happened without reproducing it. That’s the test. If a log doesn’t help you answer “what was the system doing, for whom, and what went wrong,” it’s noise. Logs should provide enough context to understand an event without needing to reproduce the issue — timestamps, clear error messages, and unique identifiers to trace across systems [1].
Keep that one sentence in your head and most of the decisions below become obvious.
Log levels: stop using them as decoration
Almost everyone gets log levels slightly wrong. They sprinkle logger.info and logger.debug around based on vibes, and then in production everything is either silent or a firehose. Log levels are a severity contract, not a style choice. Get the contract right and you can filter signal from noise instantly.
The standard hierarchy, lowest to highest priority [4]:
| Level | When to use it | Should it page someone? |
|---|---|---|
| TRACE | Ultra-fine-grained flow, per-loop iteration. Rarely on in prod. | No |
| DEBUG | Variable states, API payloads, execution branches — developer diagnostics [2] | No |
| INFO | Normal runtime events: startup, shutdown, user actions, state changes | No |
| WARN | Something’s off but the system recovered or degraded gracefully | Maybe (trend) |
| ERROR | An operation failed, but the app keeps running [3] | Often |
| FATAL | Unrecoverable — app is about to exit (missing config at boot, OOM) [3] | Yes |
A few opinions I’ll die on:
- INFO is your production default. Set the threshold to INFO and you capture INFO, WARN, ERROR, FATAL while dropping DEBUG noise [5]. That’s the right baseline for almost every service.
- DEBUG is for transient debugging, then turn it off. Writing extensive DEBUG logs adds real I/O overhead that slows high-throughput systems and inflates latency [1]. Don’t leave it on “just in case.”
- WARN is the most abused level. A retry that succeeded is a WARN. A failed request the user actually saw is an ERROR. If you can’t tell the difference between “we handled it” and “the customer got a 500,” your alerts are lying to you.
- The ability to flip DEBUG on for a single service at runtime — without a redeploy — is worth its weight in gold. That’s the legitimate use of DEBUG in prod: turn it on for ten minutes, capture the weird case, turn it back off.
Get this right and your on-call dashboard becomes “show me all ERROR and FATAL in the last 15 minutes” — a query that actually means something.
What to actually log (and what to never log)
The fields every log line should carry
If you take one thing from this article, make it this: stop logging strings, start logging structured key-value records. Structured logging emits machine-readable key-value pairs (typically JSON) instead of free text, so each field is independently queryable for filtering and correlation across services [12]. The difference at query time is night and day — grep versus an actual WHERE order_id = '...'.
Every production log line should carry, at minimum [12]:
- timestamp — ISO 8601, in UTC. Always UTC. Timezone bugs during an incident are their own special hell.
- level — the severity from above
- service — which service emitted it
- event — a short, consistent name like
payment.capturedororder.rejected - trace_id and request_id — the correlation glue (more on this next)
- domain fields —
user_id,order_id,tenant_id— whatever lets you slice by who and what
Here’s the same failure logged two ways. Unstructured:
ERROR Payment failed for user after timeout
Structured:
{
  "timestamp": "2026-06-20T15:42:11.204Z",
  "level": "ERROR",
  "service": "payments-api",
  "event": "payment.capture_failed",
  "trace_id": "4bf92f3577b34da6a3ce929d0e0e4736",
  "request_id": "req_8821aa",
  "user_id": "usr_4471",
  "order_id": "ord_99812",
  "gateway": "stripe",
  "error_code": "gateway_timeout",
  "duration_ms": 30021
}
The first one tells you something broke. The second one tells you payments-api timed out talking to Stripe after 30 seconds for a specific order, and lets you instantly find every other request that hit the same gateway timeout. One of these survives a 3am incident.
One more thing on field names: pick a convention and never break it. If it’s user_id in one service, don’t make it userId or user in another [4]. I’ve wasted real time joining logs across services that disagreed on casing. Stick to snake_case, write it in a shared logging library, and stop relying on humans to remember.
Log errors as structured data, not stack-trace soup
Don’t dump a raw stack trace as a giant string field. Log structured error information — error type, message, code, and the stack as its own field [12]. A stringified stack trace is unsearchable and bloats your storage. Structured error fields let you ask “how many gateway_timeout errors in the last hour” without regex gymnastics.
What to never log
This is where carelessness turns into a breach or a compliance fine. Never log secrets or PII. Usernames, passwords, security questions, API keys, access tokens, private keys, and session IDs should never hit a log [13][16]. Same for personally identifiable information — names, addresses, government IDs, full payment details [17].
And here’s the part people get wrong: don’t rely on developers to remember to redact. Someone always forgets. The right approach is automated filters that strip secrets before they’re written, plus an allowlist — explicitly define the non-sensitive fields you’re allowed to include, rather than trying to blocklist every sensitive one [16][17]. Allowlists fail safe; blocklists fail open.
The OWASP Logging Cheat Sheet is the canonical reference here, and it’s worth a read if you’re handling anything regulated [15].
Correlating across services: the part that actually matters
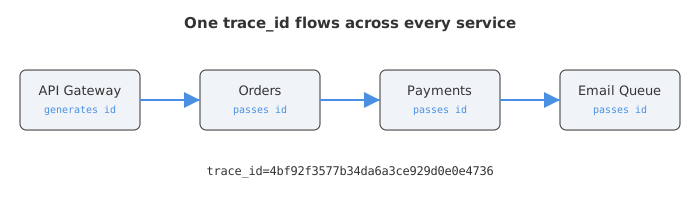
Here’s where logging in a distributed system gets genuinely hard. In a monolith, one request = one thread = one continuous log stream. In microservices, a single user action might touch six services, two queues, and a background job — and each one logs to its own stream. Without a thread connecting them, you’ve got six separate murder mysteries instead of one.
The thread is a correlation ID (or trace ID): a unique identifier attached to a request that travels with it across every service boundary [9]. When a request enters your system, it gets an ID. Every service extracts that ID from the incoming request and passes it along in the headers of any downstream calls [10]. Then every log line includes it. Now you can pull every log across every service for that one request with a single query.
Don’t invent your own header — use W3C Trace Context
You could roll your own X-Correlation-ID header, and plenty of teams do. But there’s a standard now, and it’s worth adopting. The W3C Trace Context spec defines a traceparent header that everything understands [13]. Its format is dead simple:
traceparent: 00-4bf92f3577b34da6a3ce929d0e0e4736-00f067aa0ba902b7-01
             │  │                                │                │
          version  trace-id (32 hex)        parent span-id    flags
The trace ID identifies the whole request journey; the span ID identifies one operation within it [14]. Use this and any compliant tool — Jaeger, Zipkin, Sentry, Datadog — can stitch your trace together without custom glue [10].
Logs vs traces — they’re cousins, not twins
People conflate these, so let me be blunt about the difference:
- A trace is the structured timeline of a request across services, made of nested spans, each span being one operation with a start, end, and duration.
- A log is a point-in-time event with context.
The magic happens when you put the trace_id into your log lines. Then you can jump from a slow span in your trace view straight to the exact logs emitted during that span. That’s the whole game of modern distributed tracing [8].
OpenTelemetry is the tool I’d reach for here. Its SDKs use W3C Trace Context as the default propagation format, so if you instrument with OTel you get cross-service correlation basically for free [13]. No need to hand-thread headers through every HTTP client.
A practical tip: thread-local context
In most frameworks you don’t want to pass the correlation ID through every function signature manually — that’s miserable. Use a context mechanism: MDC (Mapped Diagnostic Context) in the Java/SLF4J world, context.Context in Go, async local storage in Node. You set the trace ID once when the request arrives, and the logging framework automatically stamps it on every line for the rest of that request [10]. Set it in middleware, forget about it.
The canonical log line: my favourite underrated pattern
This one changed how I think about logging, and it comes from Stripe’s engineering blog. The idea: alongside your normal scattered logs, emit one fat, structured log line at the end of every request that contains all the important telemetry in one place [20].
So at the end of a request you emit a single line carrying: the route, the user ID, the response status, total duration, which downstream services were called and how long each took, the auth method, the trace ID — everything that matters about that request, colocated.
Why is this so good? Because during an incident, you write one query against one line instead of piecing together five separate log statements [20]. The community has rediscovered this exact idea under the name wide events — one comprehensive event per request with every attribute attached [20]. Same concept, and it’s the direction observability is heading.
The clever implementation detail from Stripe: they wrap the emission in an ensure block (a finally, basically) so the canonical line gets written even if the request threw an exception mid-flight [20]. Here’s the shape of it:
def handle_request(req):
    ctx = {"request_id": req.id, "route": req.route, "user_id": req.user_id}
    try:
        result = process(req)
        ctx["status"] = result.status
        return result
    finally:
        ctx["duration_ms"] = elapsed_ms()
        logger.info("canonical_line", **ctx)   # always runs
Do regular logging and a canonical line per request. The regular logs give you the play-by-play; the canonical line gives you the box score.
Keeping logs affordable: sampling without going blind
Logs get expensive fast, and the naive reaction — “just log less” — usually means you turn off the thing you needed. The smarter move is sampling: keep only part of the stream, but be deliberate about which part [18].
The strategy I’d recommend for high-volume systems [18][19]:
- Never sample errors and warnings. They’re rare and high-value. Keep 100% of them.
- Sample the boring stuff aggressively — health checks, successful auth, routine 200s. Keeping 1 in 100 still shows you clear traffic patterns [18].
- Always record the sample rate in the log itself, so your analysis can multiply back up and not lie to you about volumes [18].
- Tier your storage — hot/searchable for recent logs, cheap cold archive for older ones. Structured logs make this easy because every line has queryable metadata to route on [12].
Datadog, Better Stack and others have good deep-dives on tuning this, but the principle holds everywhere: sample noise, never sample signal, and always know your rate.
Also — boring but it bites people — rotate and archive your logs. Unbounded log files fill disks and take down the very service you were trying to observe [1]. Set rotation, set retention, move on.
A quick gut-check list
Before you call your logging “done,” run through this:
- Are logs structured JSON with consistent field names? [12]
- Does every line carry a
trace_idthat propagates across services? [13] - Is INFO your prod default, with DEBUG flippable at runtime? [5]
- Do ERROR and FATAL mean something an on-call human should care about? [3]
- Are secrets and PII stripped by an automated allowlist, not developer memory? [16]
- Do you emit one canonical/wide line per request? [20]
- Are errors and warnings exempt from sampling? [18]
- Are timestamps UTC and ISO 8601? [12]
If you can tick those, your next 3am page is going to be a lot shorter.
The goal was never “log everything.” It’s to make sure that when something breaks — and it will — the answer is already sitting in a query you can write in fifteen seconds, half-awake, with the pager still buzzing.
Sources
- Logging Best Practices: 12 Tips for Developers and SREs — Parseable
- Logging Levels Explained — SigNoz
- Log Debug vs. Info vs. Warn vs. Error and Fatal — Edge Delta
- Log Levels: Different Types and How to Use Them — Last9
- Log Levels Explained and How to Use Them — Better Stack
- Logging Best Practices: 12 Dos and Don’ts — Better Stack
- Logging Best Practices: The 13 You Should Know — DataSet
- Pattern: Distributed tracing — microservices.io
- Understanding and Implementing Correlation ID in Microservices — Anil Goyal
- Distributed Tracing Logs: How They Work & Best Practices — groundcover
- Structured Logging in Production: Best Practices for Scalable Systems — OpenObserve
- Structured Logging: Best Practices & JSON Examples — Uptrace
- OpenTelemetry Context Propagation: W3C TraceContext — Uptrace
- Traceparent: How OpenTelemetry Connects Your Microservices — Last9
- Logging Cheat Sheet — OWASP
- Best Logging Practices for Safeguarding Sensitive Data — Better Stack
- How to Keep Sensitive Data Out of Your Logs: 9 Best Practices — Skyflow
- Log Sampling: Techniques, Challenges & Best Practices — groundcover
- How to Reduce Logging Costs with Log Sampling — Better Stack
- Fast and flexible observability with canonical log lines — Stripe
- How to optimize high-volume log data without compromising visibility — Datadog